Video generation has witnessed significant advancements, yet evaluating these models remains a challenge. A comprehensive evaluation benchmark for video generation is indispensable for two reasons: 1) Existing metrics do not fully align with human perceptions; 2) An ideal evaluation system should provide insights to inform future developments of video generation. To this end, we present VBench, a comprehensive benchmark suite that dissects "video generation quality" into specific, hierarchical, and disentangled dimensions, each with tailored prompts and evaluation methods. VBench has three appealing properties: 1) Comprehensive Dimensions: VBench comprises 16 dimensions in video generation (e.g., subject identity inconsistency, motion smoothness, temporal flickering, and spatial relationship, etc). The evaluation metrics with fine-grained levels reveal individual models' strengths and weaknesses. 2) Human Alignment: We also provide a dataset of human preference annotations to validate our benchmarks' alignment with human perception, for each evaluation dimension respectively. 3) Valuable Insights: We look into current models' ability across various evaluation dimensions, and various content types. We also investigate the gaps between video and image generation models. 4) Versatile Benchmarking: VBench++ is designed to evaluate a wide range of video generation tasks, including text-to-video and image-to-video. We introduce a high-quality Image Suite with an adaptive aspect ratio to enable fair evaluations across different image-to-video generation settings. Beyond assessing technical quality, VBench++ evaluates the trustworthiness of generative models, providing a more holistic view of model performance. 5) Full Open-Sourcing: We fully open-source VBench, including all prompts, evaluation methods, generated videos, and human preference annotations. We also continually add new video generation models to the VBench leaderboard to drive forward the field of video generation.
We visualize the evaluation results of the 12 most recent top-performing long video generation models across 16 VBench dimensions. We normalize the results per dimension for clearer comparisons.
The values have been normalized for better readability of the chart. The normalization process involves scaling each set of performance values to a common scale between 0.3 and 0.8. The formula used for normalization is: (value - min_value) / (max_value - min_value).
We visualize the evaluation results of various publicly available video generation models across 16 VBench dimensions. We normalize the results per dimension for clearer comparisons.
The values have been normalized for better readability of the chart. The normalization process involves scaling each set of performance values to a common scale between 0.3 and 0.8. The formula used for normalization is: (value - min_value) / (max_value - min_value).
We visualize the evaluation results of various closed sourced video generation models across 16 VBench dimensions. We normalize the results per dimension for clearer comparisons.
The values have been normalized for better readability of the chart. The normalization process involves scaling each set of performance values to a common scale between 0.3 and 0.8. The formula used for normalization is: (value - min_value) / (max_value - min_value).
We visualize the evaluation results of six image-to-video generation models in VBench++'s I2V dimensions.
The values have been normalized for better readability of the chart. The normalization process involves scaling each set of performance values to a common scale between 0.3 and 0.8. The formula used for normalization is: (value - min_value) / (max_value - min_value).
We visualize the trustworthiness evaluation results of visual generative models and image generation models.
The values have been normalized for better readability of the chart. The normalization process involves scaling each set of performance values to a common scale between 0.3 and 0.8. The formula used for normalization is: (value - min_value) / (max_value - min_value).
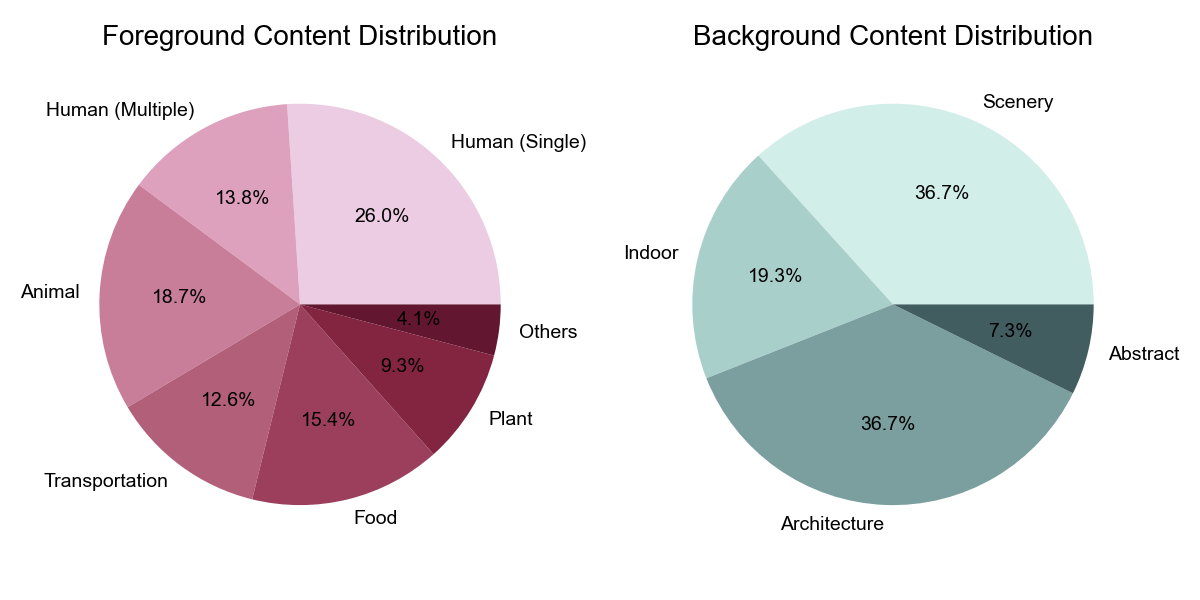
The two graphs provide an overview of our prompt suites. Left: the word cloud to visualize word distribution of our prompt suites. Right: the number of prompts across different evaluation dimensions and different content categories.

We use VBench to evaluate other models and baselines for further comparative analysis of T2V models, such as text-to-image (T2I) generation models
The values have been normalized for better readability of the chart. The normalization process involves scaling each set of performance values to a common scale between 0.3 and 0.8. The formula used for normalization is: (value - min_value) / (max_value - min_value).
For each chart, we plot the VBench evaluation results across eight different content categories, benchmarked by our Prompt Suite per Category.
The results are linearly normalized between 0 and 1 for better visibility across categories.
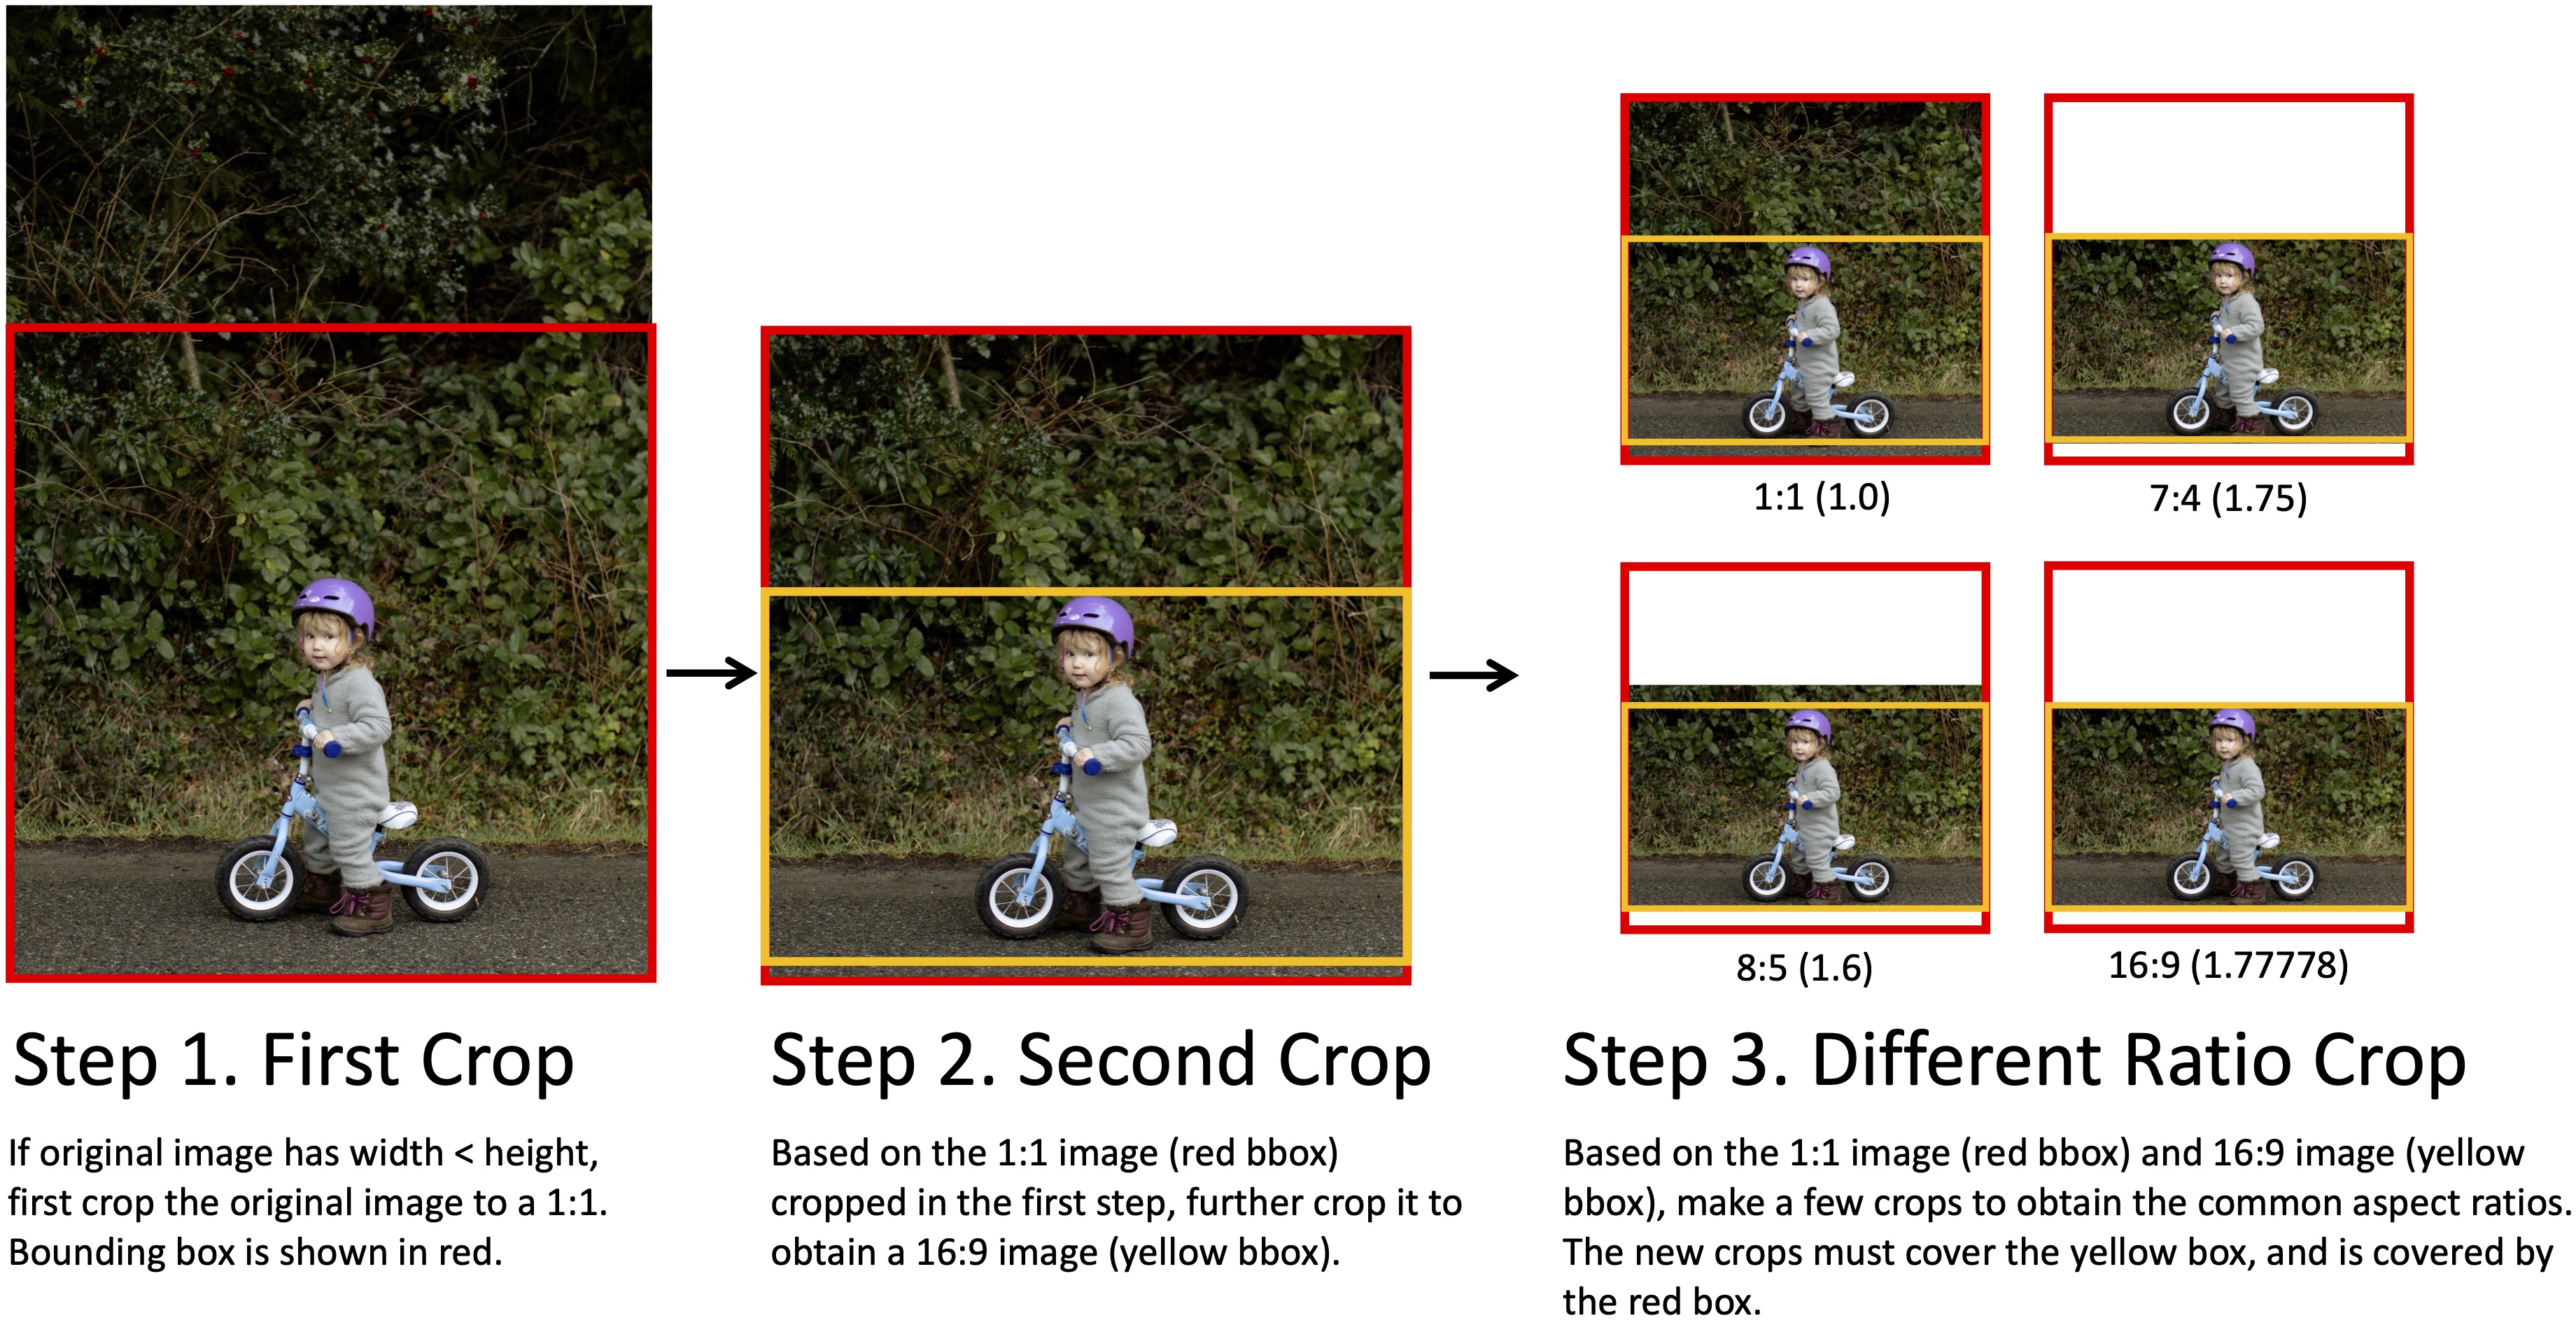
(a) Cropping Pipeline for Portrait Images.
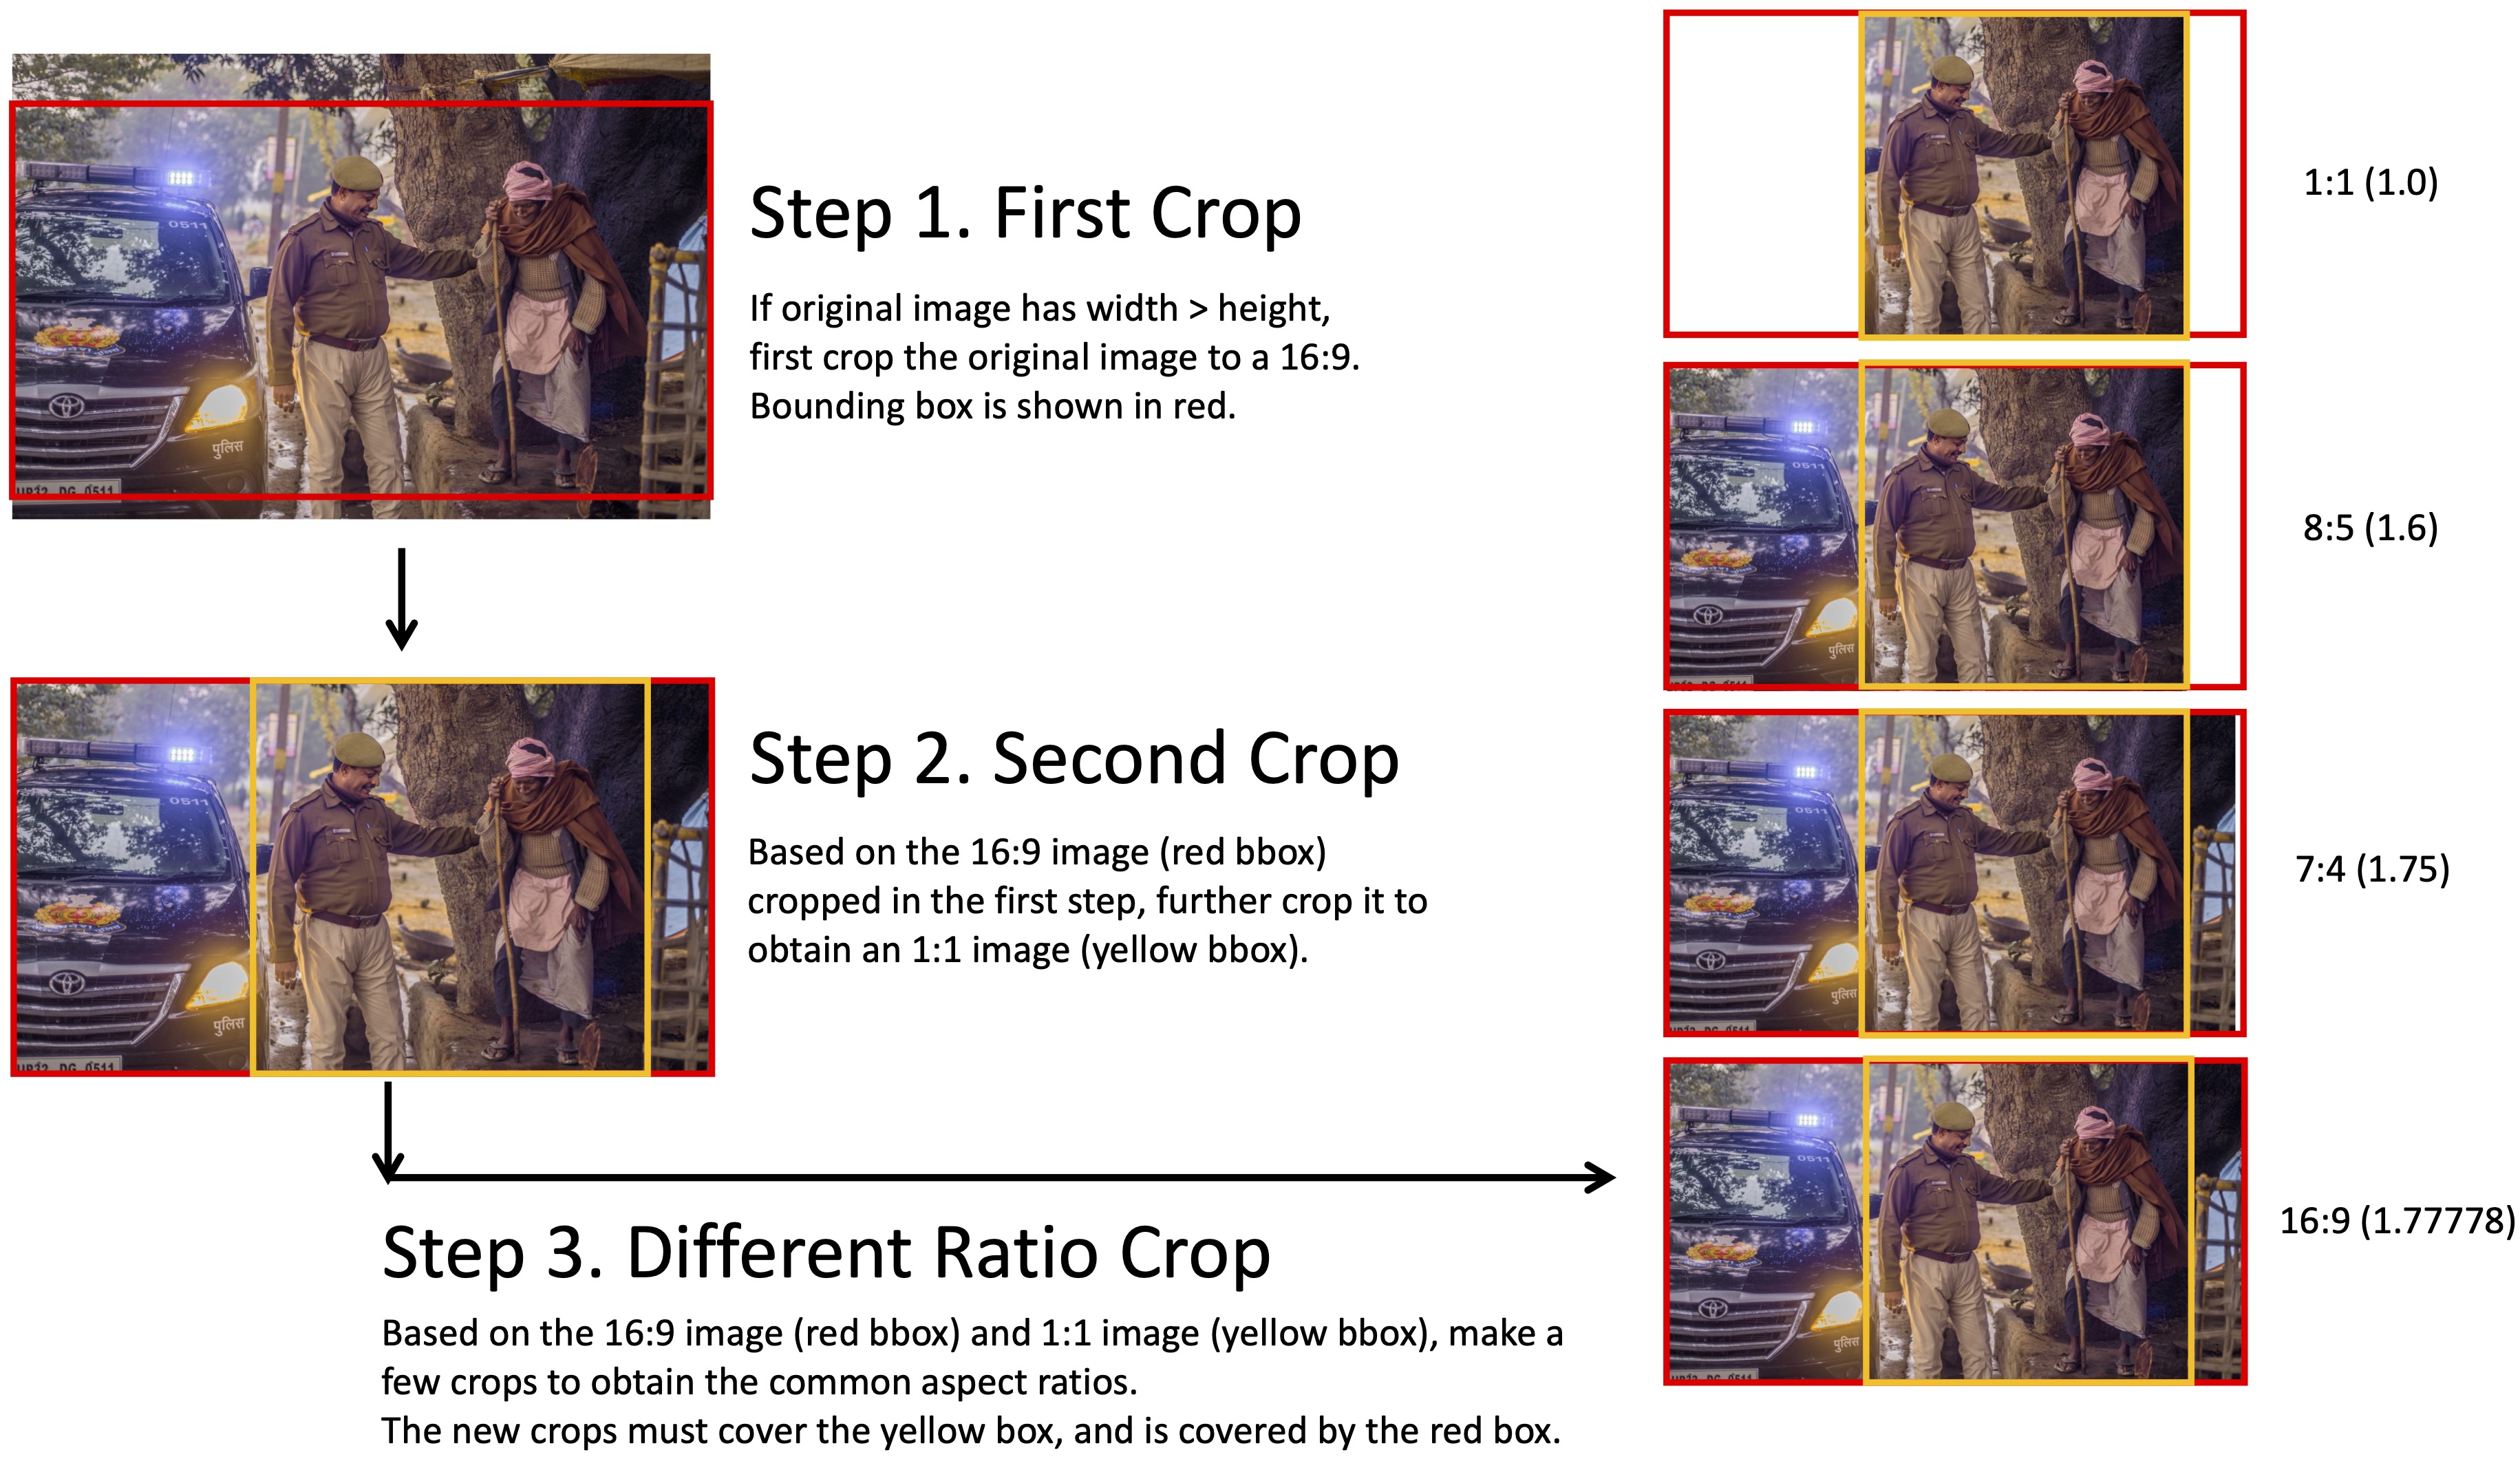
(b) Cropping Pipeline for Landscape Images.
Image Suite Pipeline for Adaptive Aspect Ratio Cropping. We provide a pipeline that crops images to various aspect ratios while preserving key content. (a) Portrait Images. If the original image's width is less than its height, it is first cropped to a 1:1 ratio (red bounding box). followed by a second crop to a 16:9 aspect ratio (yellow bounding box). Additional crops interpolate between the 1:1 red box and the 16:9 yellow box to produce other common ratios (1:1, 7:4, 8:5, 16:9). (b) Landscape Images. If the original image's width is greater than its height, we first crop the image to a 16:9 aspect ratio (red bounding box), and further crop the 16:9 image to a 1:1 aspect ratio (yellow bounding box). We then perform additional crops between the 16:9 red box and 1:1 yellow box to obtain the common aspect ratios (1:1, 7:4, 8:5, 16:9).
If you find our work useful, please consider citing our paper:
@InProceedings{huang2023vbench,
      title={{VBench}: Comprehensive Benchmark Suite for Video Generative Models},
      author={Huang, Ziqi and He, Yinan and Yu, Jiashuo and Zhang, Fan and Si, Chenyang and Jiang, Yuming and Zhang, Yuanhan and Wu, Tianxing and Jin, Qingyang and Chanpaisit, Nattapol and Wang, Yaohui and Chen, Xinyuan and Wang, Limin and Lin, Dahua and Qiao, Yu and Liu, Ziwei},
      booktitle={Proceedings of the IEEE/CVF Conference on Computer Vision and Pattern Recognition},
      year={2024}
}

@article{huang2024vbench++,
  title={VBench++: Comprehensive and Versatile Benchmark Suite for Video Generative Models},
  author={Huang, Ziqi and Zhang, Fan and Xu, Xiaojie and He, Yinan and Yu, Jiashuo and Dong, Ziyue and Ma, Qianli and Chanpaisit, Nattapol and Si, Chenyang and Jiang, Yuming and Wang, Yaohui and Chen, Xinyuan and Chen, Ying-Cong and Wang, Limin and Lin, Dahua and Qiao, Yu and Liu, Ziwei},
  journal={arXiv preprint arXiv:2411.13503},
  year={2024}
}
Our related projects: Evaluation Agent
@article{zhang2024evaluationagent,
  title = {Evaluation Agent: Efficient and Promptable Evaluation Framework for Visual Generative Models},
  author = {Zhang, Fan and Tian, Shulin and Huang, Ziqi and Qiao, Yu and Liu, Ziwei},
  journal={arXiv preprint arXiv:2412.09645},
  year = {2024}
}